
Increase solar power

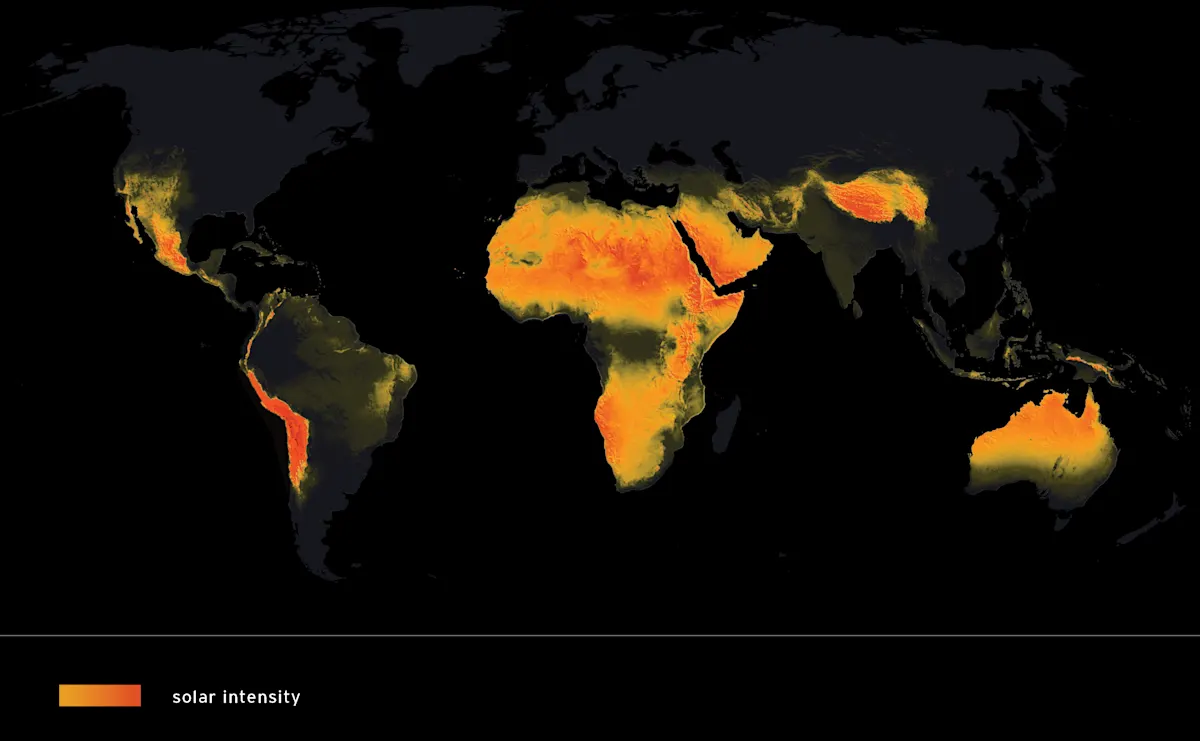
THE SUNLIGHT THAT STRIKES THE EARTH EVERYDAY CONTAINS 10,000 TIMES MORE ENERGY THAN WE CONSUME FROM ALL OTHER SOURCES.
Solar power currently accounts for less than 2% of our global energy supply.
sources: map illustration - global horizontal irradiance, Vaisala, Global Solar Atlas, World Bank Group, ESMAP, Vortex. | stats - U.S. Department of Energy. Top Six Things You Didn't Know About Solar Energy; International Energy Association, World Energy Balances Overview.

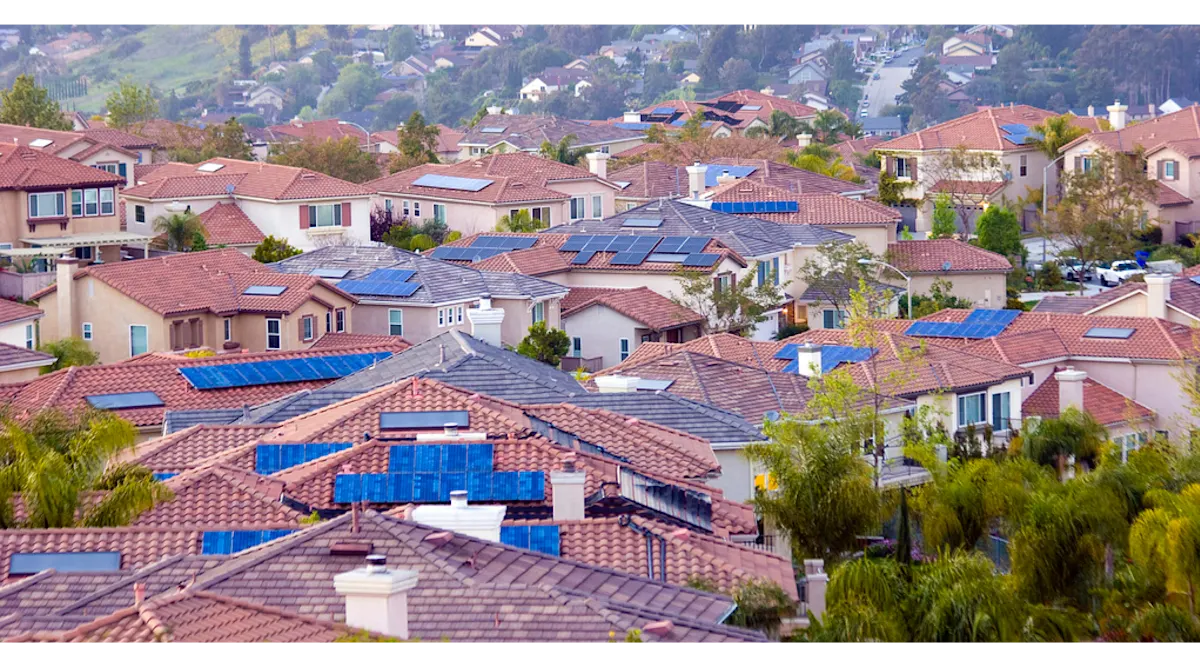
"IF EVERY AVAILABLE ROOFTOP WAS EQUIPPED WITH SOLAR PANELS, THEY COULD GENERATE ENOUGH ELECTRICITY TO POWER THE WORLD."
"Rooftop solar has the advantage of both reducing local air pollution—where it replaces conventional fossil fuel-based energy... and reducing transmission network loads by decentralizing electricity supply... it can do all that without impacting the land and ecosystems, as it is installed exclusively on existing buildings."

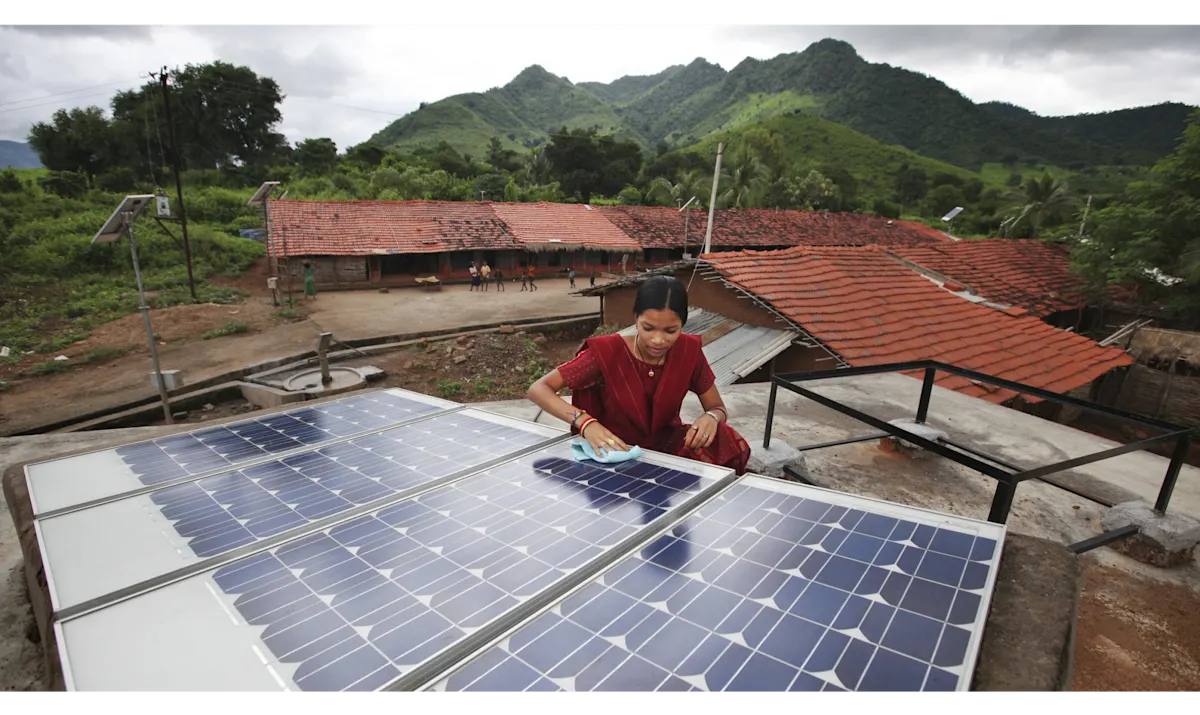
"THE LOWEST COSTS FOR ROOFTOP SOLAR CAN BE ATTAINED IN DENSELY POPULATED REGIONS IN CHINA AND INDIA...
the world's two most populous nations, which face huge challenges in simultaneously cutting carbon emissions while providing increasingly more energy... At a price of $66 per MWh in India and $68 per MWh in China, rooftop solar in these countries is cost competitive."
source: David Vetter, Could Rooftop Solar Really Provide Enough Electricity For The Entire World? Forbes. 2021. | image one: Kevin Baird via Flickr CC2.0 | image two: a woman maintaining rooftop solar panels in rural India. UK Department for International Development via Flickr. CC2.0
When do we use the most electricity?

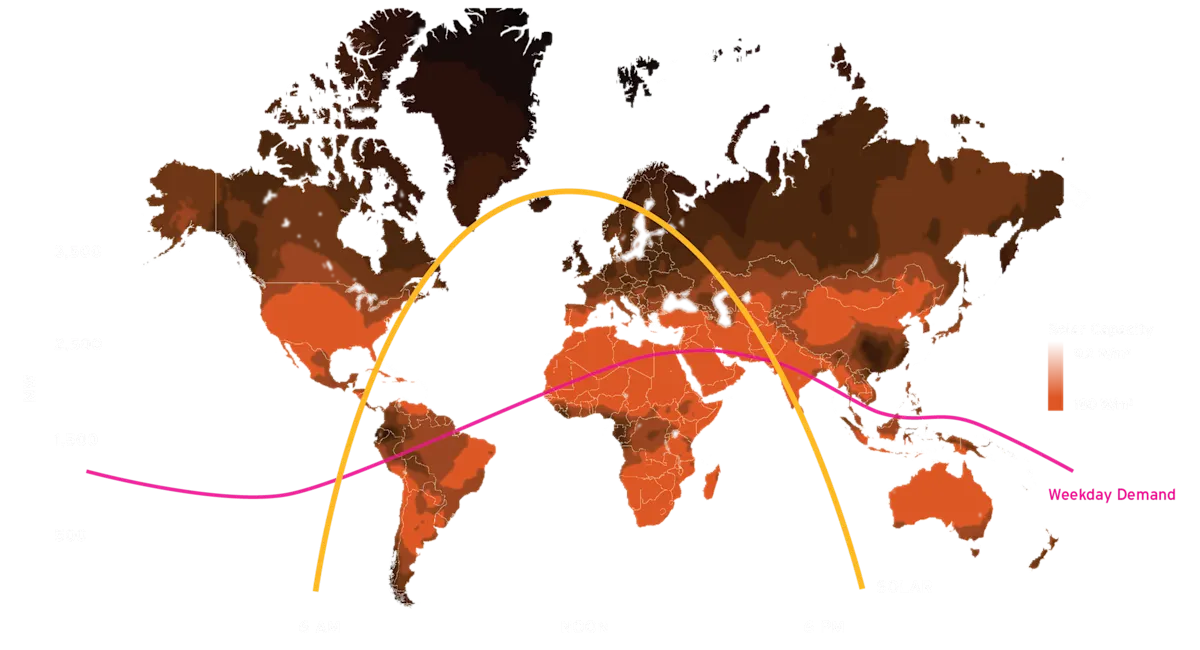
When the sun is shining.
With some of the highest solar capacity in the world, the developing world is positioned to benefit from the development of renewable energy.
Sources: U.S. Energy Information Administration, “Electricity Demand Changes in Predictable Patterns,” 2011. U.S. EIA, “California continues to set daily records for utility scale solar energy”, 2014. [weekday demand curve from California during May 2014]
Land Use in the United States

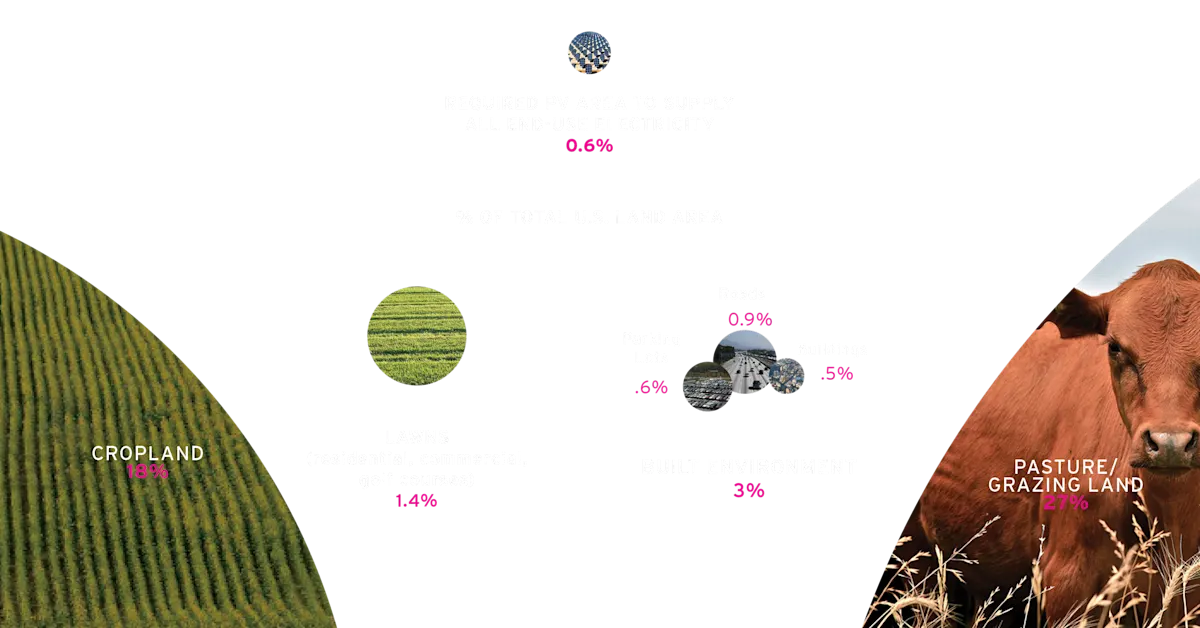
"THE LAND REQUIRED TO SUPPLY ALL END-USE ELECTRICITY IN THE UNITED STATES USING PV IS ONLY ABOUT 0.6% OF THE COUNTRY"S TOTAL LAND AREA."
"Currently, the total installed solar electric capacity provides enough solar electricity to power over 3.2 million average U.S. households"
Source: U.S. Department of Energy, SunShot Vision Study Executive Summary, February 2012. / Kimmelman, Michael. “Paved, but Still Alive.’ The New York Times. 6 Jan 2012. - The Worldwatch Institute, 2013, *including HI, AK. SEIA.
Area to Power the World with Solar Alone

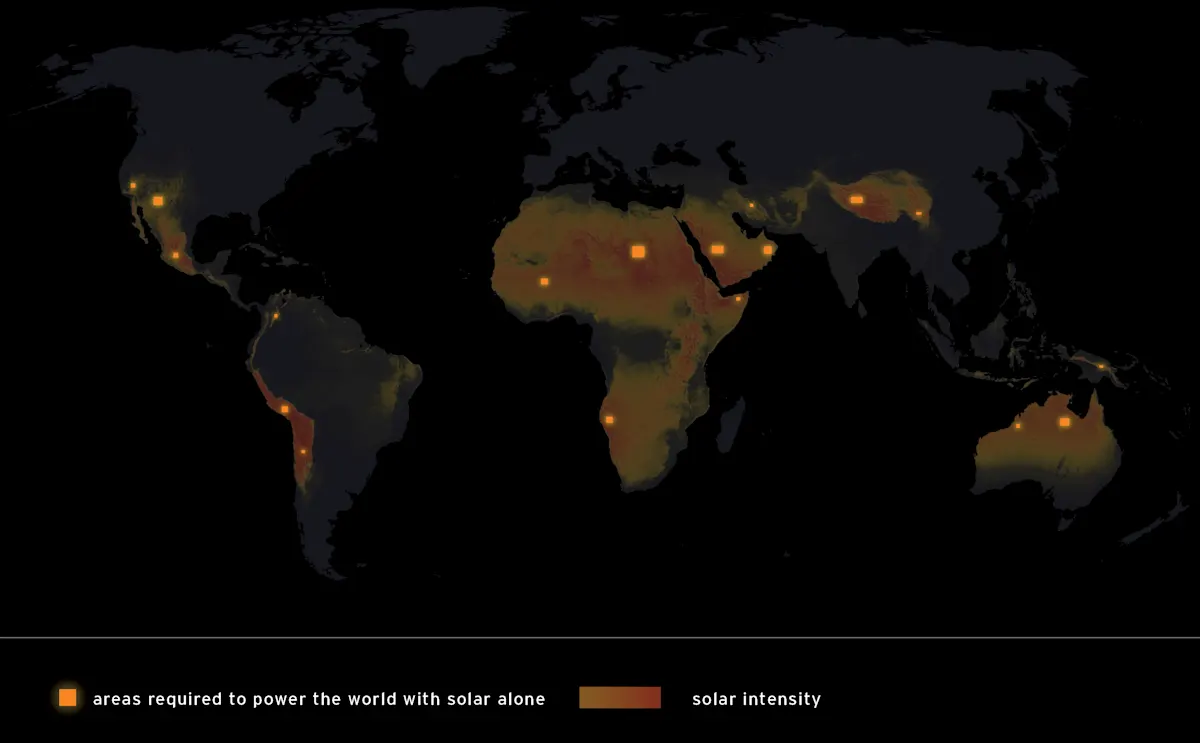
Area required to meet projected energy demand in 2030: 496,085 km^2
The 19 areas distributed on the map show the necessary share of power production for various regions based on 2009 usage. Source: “Total Area Required to Fuel the World with Solar” 2009, Land Art Generator.
Next solution


Learn about Maya Lin’s fifth and final memorial: a multi-platform science based artwork that presents an ecological history of our world - past, present, and future.

Discover ecological histories and stories of former abundance, loss, and recovery on the map of memory.

Learn how we can reduce our emissions and protect and restore species and habitats – around the world.

See how art can help us rethink the problems we face, and give us hope that each one of us can make a difference.

Help make a global memorial something personal and close to home. Share your stories of the natural world.