
Transportation Overview

95% OF THE WORLD'S TRANSPORTATION ENERGY STILL COMES FROM FOSSIL FUELS, ACCOUNTING FOR ROUGHLY ONE QUARTER OF THE WORLD'S GREENHOUSE GAS EMISSIONS.
Rethinking our transportation footprint could help reduce global greenhouse gas emissions by 10%, decreasing air pollution and reducing habitat fragmentation.
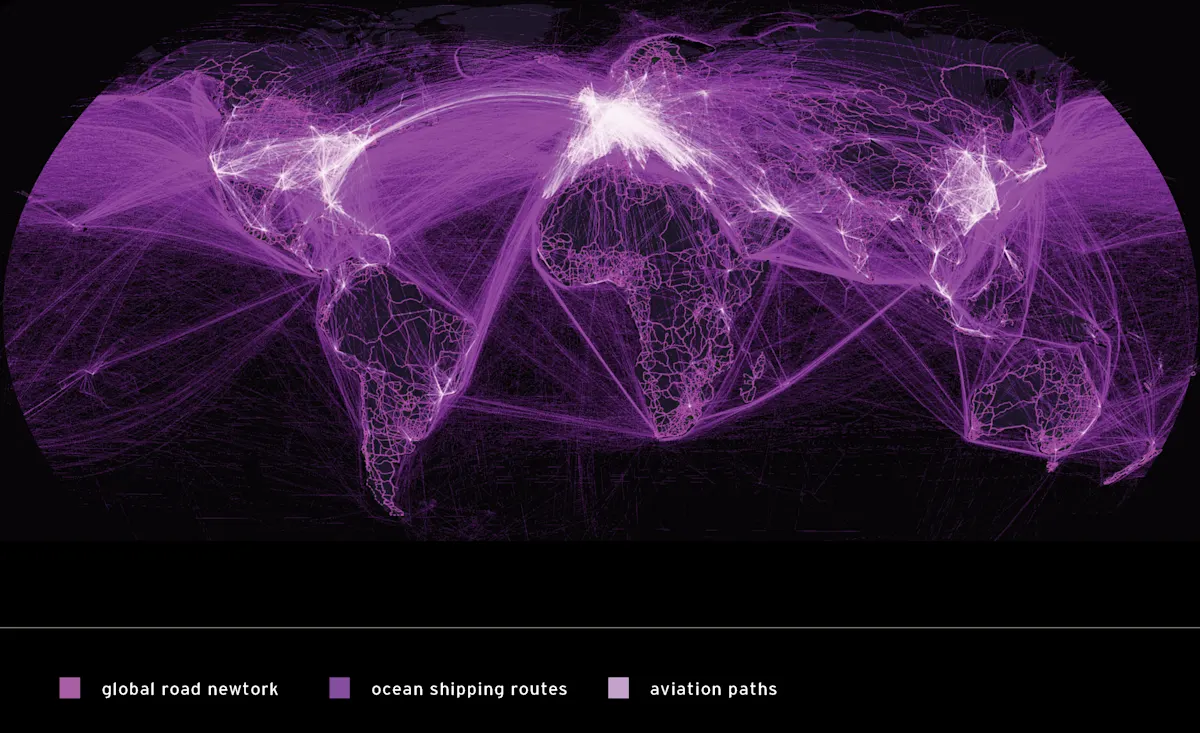
map sources: Roads: World Roads, Esri | Visualizing the human footprint, Cooper Thomas. | Flights: OpenFlights.org (commercial flights) | Visualizing the human footprint, Cooper Thomas; Global Flight Paths, Michael Markieta / ARUP. | Ocean Shipping: Shipping density (commercial). A Global Map of Human Impacts to Marine Ecosystems, showing relative density (in color) against a black background. Scale: 1 km. B.S. Halpern (T. Hengl; D. Groll) / Wikimedia Commons.
GLOBAL TRANSPORTATION CARBON EMISSIONS

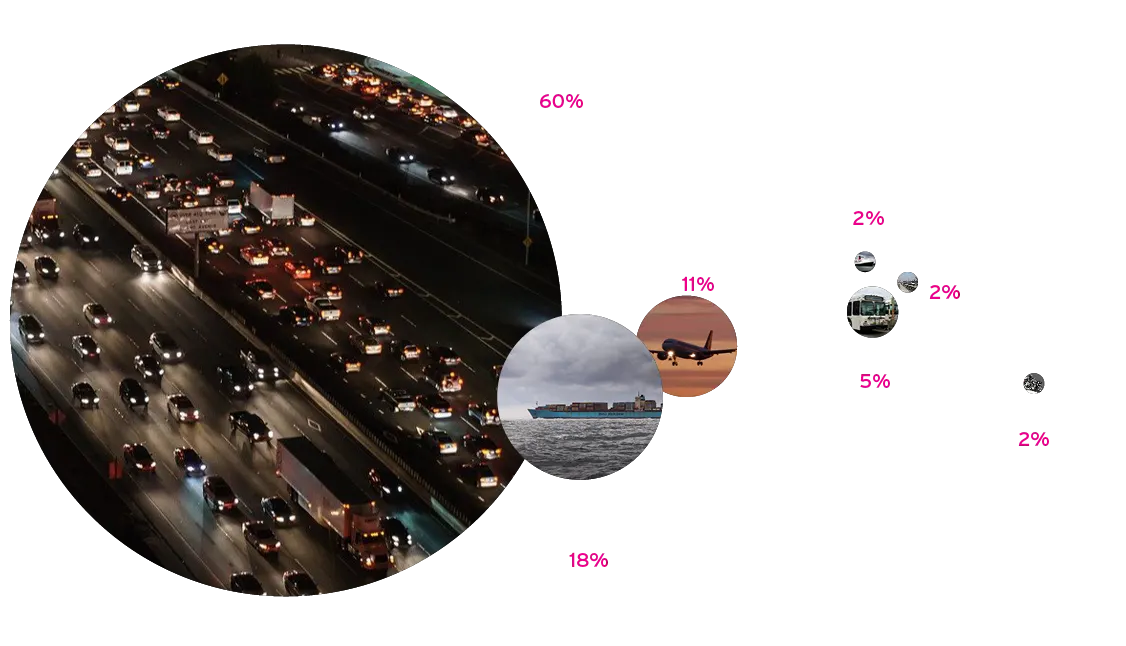
TRANSPORTATION CONSUMES NEAR 60% OF THE WORLD'S OIL.
AND DEMAND IS ANTICIPATED TO GROW 2.5% ANNUALLY - FASTER THAN ANY OTHER SECTOR OF THE WORLD ECONOMY.
Source: Lee, Mike. How Bad Are Bananas? the Carbon Footprint of Everything. Vancouver, BC: Greystone, 2011. Print. www.earthisland.org.
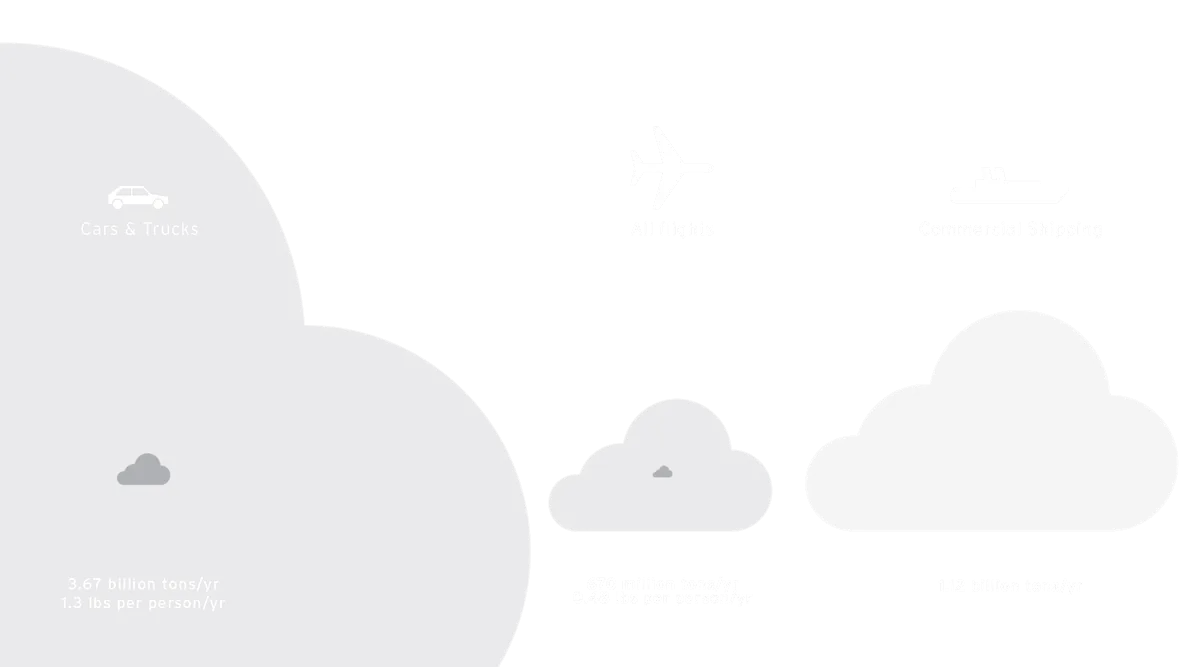
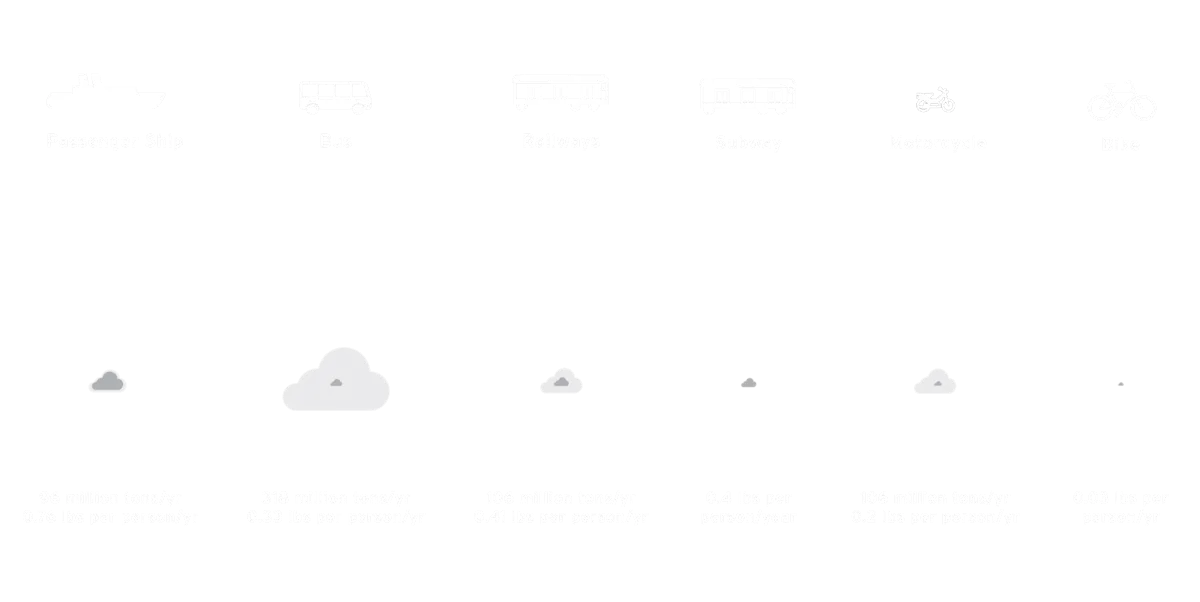
ANNUAL TRANSPORTATION CO2 EMISSIONS


THE POLLUTANTS IN VEHICLE EMISSIONS ARE KNOWN TO DAMAGE LUNG TISSUE, AND CAN LEAD TO AND AGGRAVATE RESPIRATORY DISEASES, SUCH AS ASTHMA.

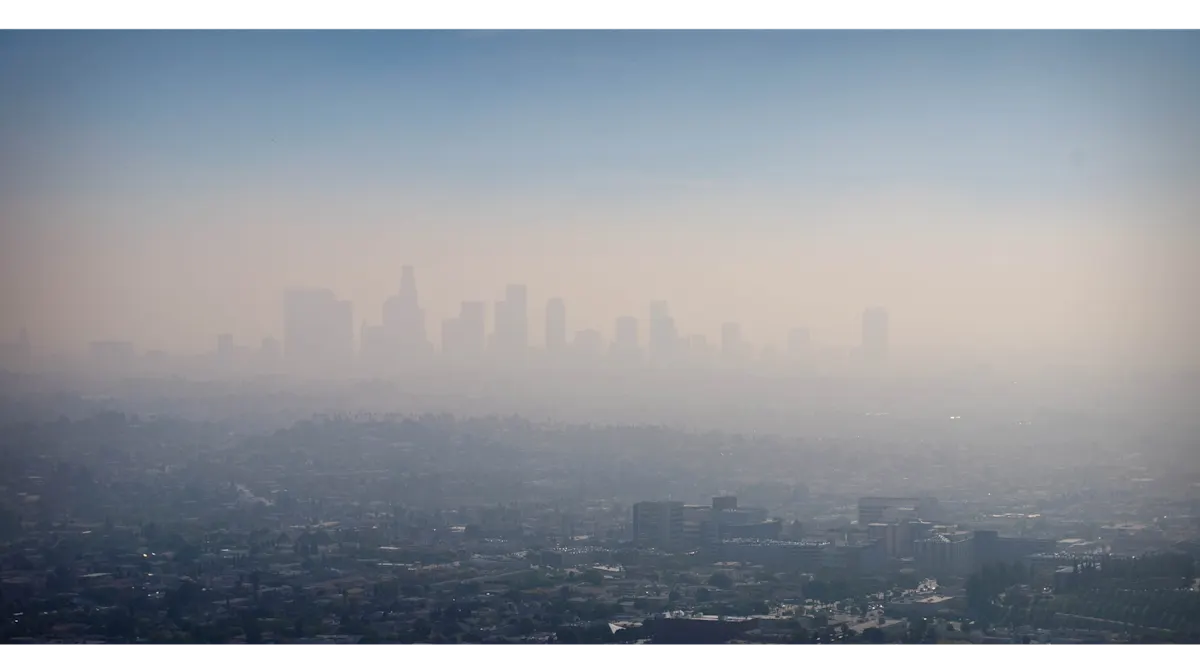
In many urban areas, motor vehicles are the single largest contributor to ground level ozone which causes coughing, wheezing, and shortness of breath, and can bring on permanent lung damage.
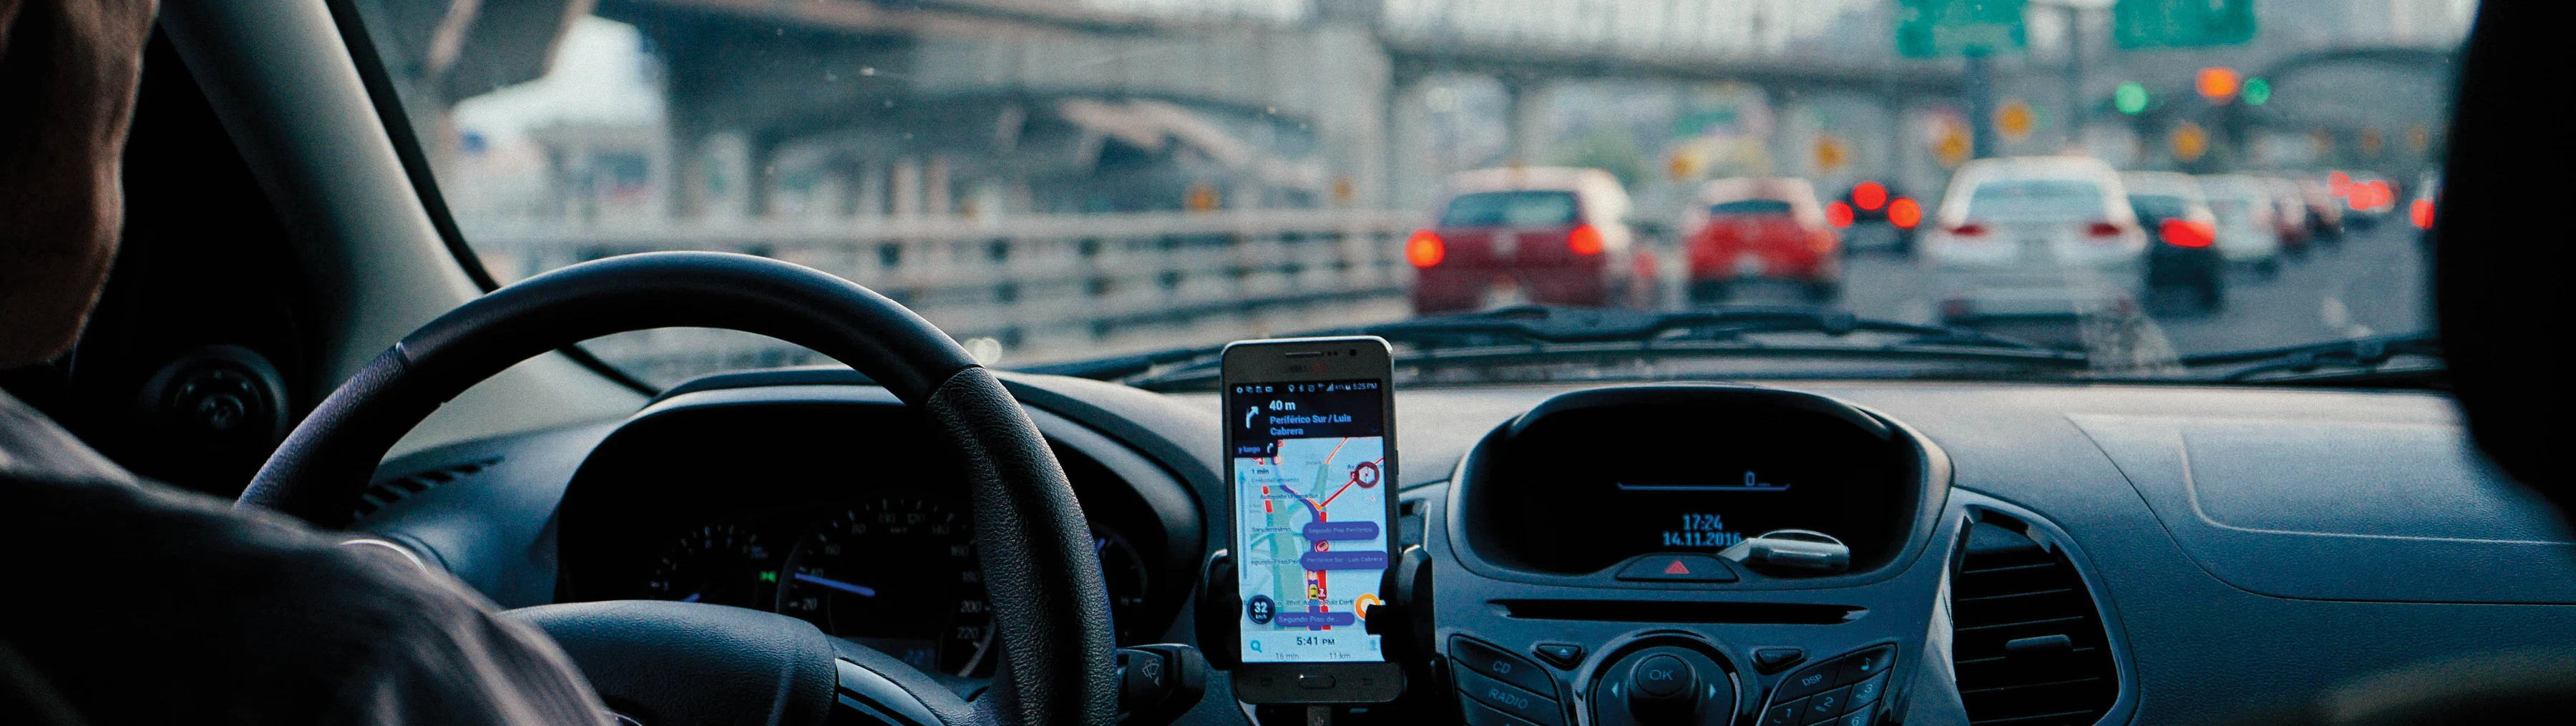
REDUCE YOUR TRANSIT FOOTPRINT
Drive Less, Drive Efficiently
Fly Less
Buy Local Goods
Sources: intro top text - United Nation's Sustainable Transport Conference Fact Sheet: Climate Change. UN.org. 2021 | intro bottom text - M.J. Bradley & Associates, 2007. | emissions bubble diagram - Lee, Mike. How Bad Are Bananas? the Carbon Footprint of Everything. Vancouver, BC: Greystone, 2011. Print. www.earthisland.org. | transport carbon footprint graphics - Source: M.J. Bradley & Associates, 2007; How Bad Are Bananas? Mike Berners-Lee, 2007; The Potential for Bus Rapid Transit, Vincent and Callaghan Jerram, 2008; International Maritime Organization 2008; Earthlab 2013 | urban transport pollutants - The New York State Department of Environmental Conservation.
Next solution

Learn about Maya Lin’s fifth and final memorial: a multi-platform science based artwork that presents an ecological history of our world - past, present, and future.
Discover ecological histories and stories of former abundance, loss, and recovery on the map of memory.
Learn how we can reduce our emissions and protect and restore species and habitats – around the world.

See how art can help us rethink the problems we face, and give us hope that each one of us can make a difference.

Help make a global memorial something personal and close to home. Share your stories of the natural world.